I’ve just finished a couple of packed events on Self-Service BI with SQL and SharePoint… thank you all for attending in Jersey on Guernsey with Dan Hare and Mark Loane – thanks also to David Grady who was instrumental in the setup of our fancy new SQL 2012 demos with REAL data… no sight of Northwind, Bicycles, Picnics or Contoso.
We used a combination of our own billing system data (anonymised of course), publicly available market data from Yahoo, and some free data from the Azure Data Market. Whether that was wise or not you can be the judges…
 Day 1: Jersey
A full house at the Pomme D’Or Hotel in St. Helier – great turn out and some good questions about combining versions of existing products with the shiny new technologies demonstrated. Apart from a minor mishap with a mouse breaking and a power cut nobody was hurt! Thanks to Cloudshare we recovered without anybody noticing… kind of…
Day 2: Guernsey
Little did we know when booking the Guernsey trip that the airport was shut for two days… Captain Mark to the rescue and a short boat trip across to St. Peter Port! Another full house at Old Government House and an excitable audience with absolutely tonnes of questions including SharePoint User Group in the Channel Islands (get involved here!). Too many others to mention.. thanks to Marc Laine for the massive build-up!
As promised you can view the slides here:
I also include screenshots from the fun demos below:
Scenario 1: Market Data using Reporting Services and SharePoint Foundation
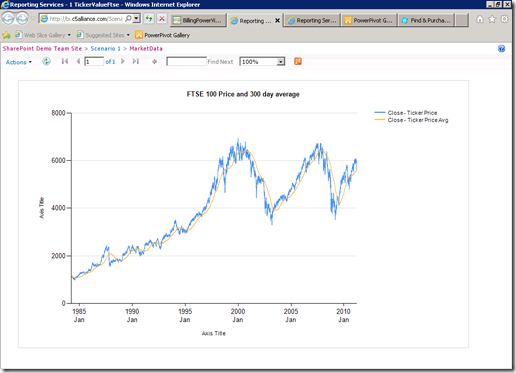
Market Data (FTSE 100)
SQL 2008 Reporting Services hosted in SharePoint Foundation 2010
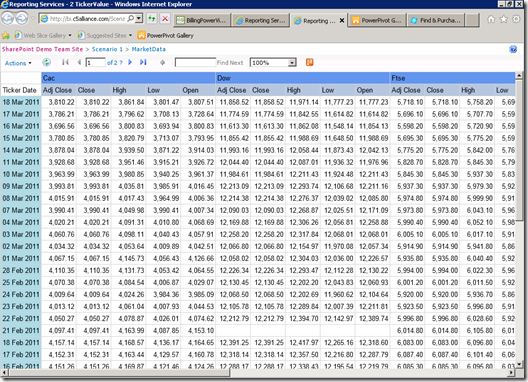
Market Data (Cac, Dow, Ftse)
Grid of the Shared Data Set (note the orange Atom data feed icon)
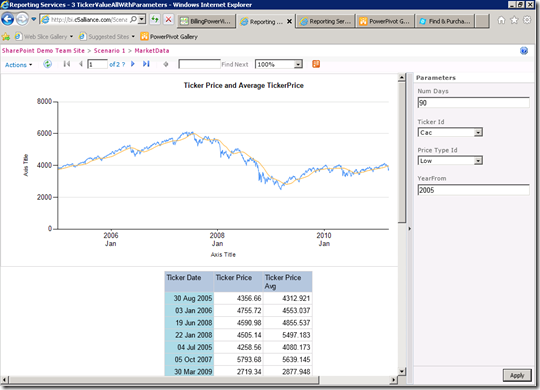
Parameterised Reporting Services with Ticker Price &
SQL 2008 R2 Reporting Services with Parameters
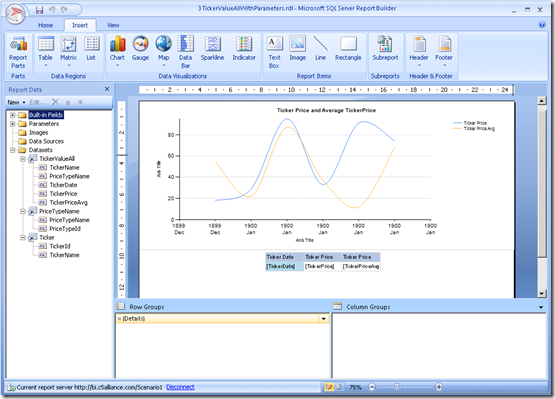
Report Builder 2012 (Free; very similar to 2008 R2)
Scenario 2: Visio Services 2010 and Performance Point Services 2010
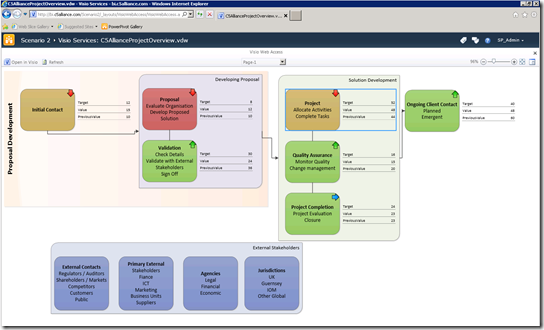
Service Delivery Model with Linked Data Source
Visio Services 2010 (requires SharePoint 2010 Enterprise CALs)
Office/Visio Web Access
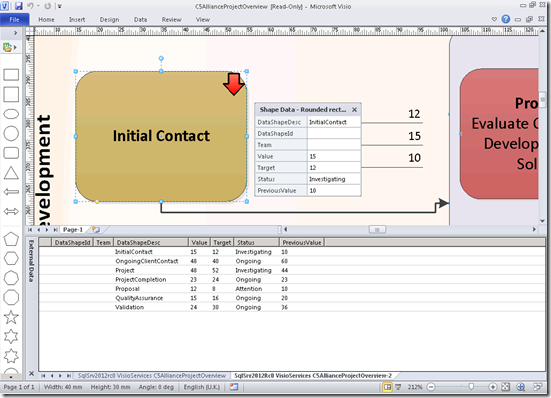
Service Delivery Model in Visio – set data sources
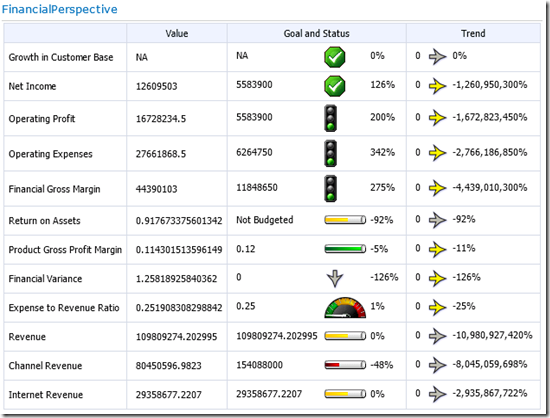
Organisation Dashboard
Performance Point Services 2010 (requires SharePoint 2010 Enterprise CALs)
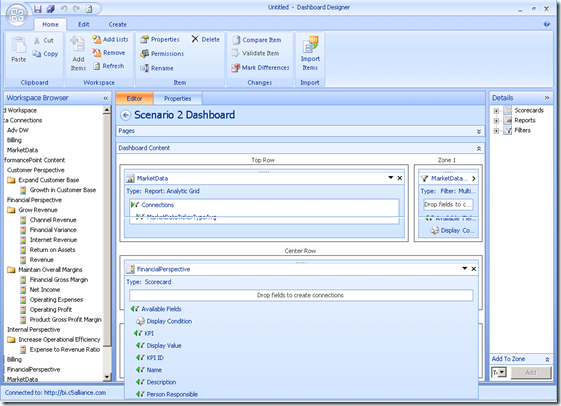
Dashboard Designer 2010 (Free)
Scenario 3: Power View – Market & Billing Data
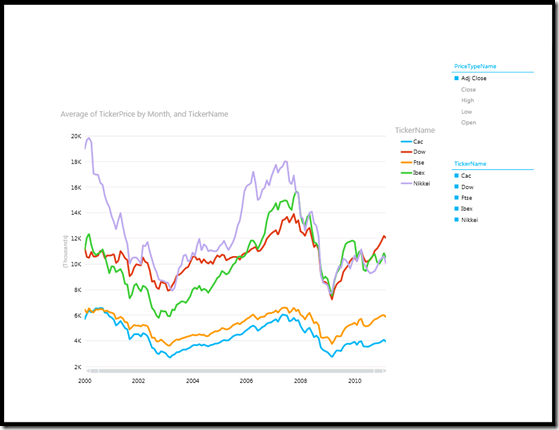
Market Data rendered in Power View – interactive filter & X-Axis
SQL Server 2012 Enterprise or Business Intelligence, Integrated SharePoint Reporting Services
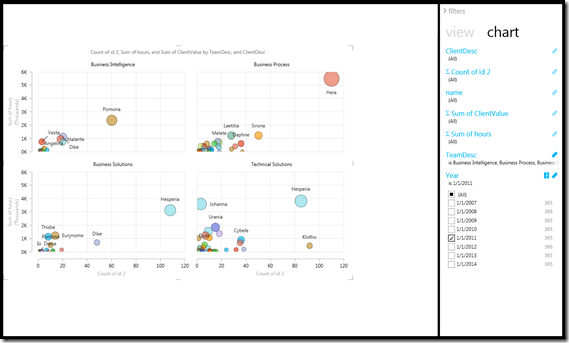
Bubble Chart: Filtered Billing Data in Power View
Clients represented by bubbles with number of scopes along X-Axis
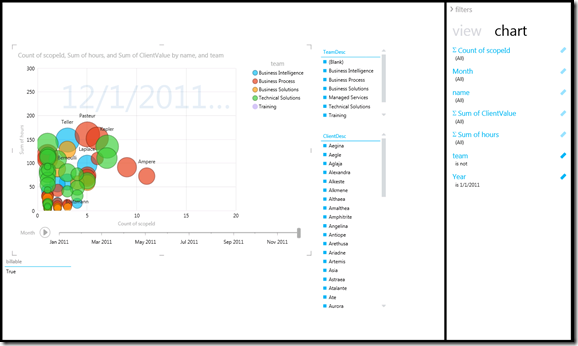
Bubble Chart: “Play” button progresses in time
Power View Video
I also recorded a short video of the final Power View demo using Lync which has been uploaded to my SkyDrive:
Finally
If you made it this far, well done! ![]() Would be happy to chat about BI and SharePoint in general… I’ll be speaking at the International SharePoint Conference in London end of April so maybe see you there.
Would be happy to chat about BI and SharePoint in general… I’ll be speaking at the International SharePoint Conference in London end of April so maybe see you there.
Leave a Reply